|
DISTILLATION PRINCIPLES
|
|
Separation
of components from a liquid mixture via distillation depends on
the differences in boiling points of the individual components.
Also, depending on the concentrations of the components present,
the liquid mixture will have different boiling point characteristics.
Therefore, distillation processes depends on the vapour
pressure characteristics of liquid mixtures.
|
|
Vapour Pressure and Boiling
|
|
The
vapour pressure of a liquid at a particular temperature is the
equilibrium pressure exerted by molecules
leaving and entering the liquid surface. Here are some important
points regarding vapour pressure:
|

|
energy
input raises vapour pressure
|

|
vapour
pressure is related to boiling
|

|
a
liquid is said to ‘boil’ when its vapour pressure equals
the surrounding pressure
|

|
the
ease with which a liquid boils depends on its volatility
|

|
liquids
with high vapour pressures (volatile liquids) will boil at lower
temperatures
|

|
the
vapour pressure and hence the boiling point of a liquid mixture
depends on the relative amounts of the components in the mixture
|

|
distillation
occurs because of the differences in the volatility of the components
in the liquid mixture
|
|
The Boiling Point Diagram
|
|
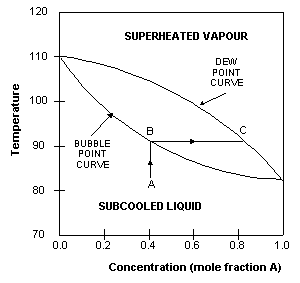
The
boiling point diagram shows how the
equilibrium compositions of the components in a liquid mixture
vary with temperature at a fixed pressure. Consider an example
of a liquid mixture containing 2 components (A and B) - a binary
mixture. This has the following boiling point diagram.
 The boiling point of A is that at which the mole fraction of A is
1. The boiling point of B is that at which the mole fraction
of A is 0. In this example, A is the more volatile component
and therefore has a lower boiling point than B. The upper curve
in the diagram is called the dew-point
curve while the lower one is called the
bubble-point
curve.
The
dew-point is the temperature at which the saturated vapour
starts to condense.
The
bubble-point is the temperature at which the liquid starts
to boil.
The
region above the dew-point curve shows the equilibrium composition
of the
superheated
vapour
while the region below the bubble-point curve shows the equilibrium
composition of the
subcooled
liquid.
For
example, when a subcooled liquid with mole fraction of A=0.4
(point A) is heated, its concentration remains constant until
it reaches the bubble-point (point B), when it starts to boil.
The vapours evolved during the boiling has the equilibrium composition
given by point C, approximately 0.8 mole fraction A. This is
approximately 50% richer in A than the original liquid.
This
difference between liquid and vapour compositions is the basis
for distillation operations.
|
|
Relative Volatility
|
Relative
volatility is a measure of the differences in volatility
between 2 components, and hence their boiling points. It indicates
how easy or difficult a particular separation will be. The relative
volatility of component ‘i’ with respect to component
‘j’ is defined as

yi
= mole fraction of component ‘i’ in the vapour
xi
= mole fraction of component ‘i’ in the liquid
Thus
if the relative volatility between 2 components is very close
to one, it is an indication that they have very similar vapour
pressure characteristics. This means that they have very similar
boiling points and therefore, it will be difficult to separate
the two components via distillation.
|

